
On April 2nd, President Donald Trump unveiled his tariff package after the market closed. While the tariff introduction was telegraphed well ahead of time, the scope and scale of the tariffs surprised financial markets. Below, we seek to address some key questions about the tariff package itself and its potential impact on the economy and financial markets.
What happened?
President Trump announced his plan for reciprocal tariffs on all United States trading partners. The highlights were as follows:
- The US will levy a base rate of 10% tariffs on every country exporting into the US starting immediately.
- This base rate will scale higher than 10% for a large number of countries where their calculated tariff rate is in excess of the 10% base rate; a tariff rate of 50% of the US's calculated tariff rate will be levied against countries (importantly, this takes into consideration dynamics such as currency manipulation and value-added taxes) starting on April 9th.
- For now, Canada and Mexico will not be subject to reciprocal tariffs, but existing 25% tariffs on non-USMCA-compliant goods will remain in place.
- Products in industries such as commodities, lumber, pharma, and semiconductors are currently exempt from the new tariff rates, but we should expect industry-specific action to follow.
How did markets respond?
Markets reacted sharply to the news, selling off aggressively. On the week, the S&P 500, Nasdaq, Russell 2000, and S&P 500 Equal Weight indices finished down 9.6%, 9.7%, 9.2%, and 9.3%, respectively.
There were wide dispersions in sector returns; Consumer Staples led the way, falling by less than 4%, while Energy, Information Technology, Financials, and Industrials all fell by double digits. Under the surface, things were even more extreme. For example, the Philadelphia Semiconductor Index (SOX) saw its largest two-day drawdown in over four decades, falling by nearly 20%. It's worth noting that ex-US markets generally held up far better than their domestic counterparts, with the MSCI All Country World ex. US Index declining by roughly 5% on the week of March 31st.
In fixed income, Treasury yields fell across the curve. The 2-year Treasury yield fell some 26bps post-announcement through the end of the week, with the 10-year Treasury yield falling nearly 26bps over the same time period. Corporate spreads widened on the news, with investment grade spreads moving out by 16bps and high yield spreads moving out another 87bps from the level they closed at on April 2nd through the end of the week.
Other notable market moves included a significant move lower in energy prices and a spike in the VIX (equity volatility index) to levels not seen since late 2020.
Stated simply, this was a fairly classic risk-off move in US financial markets.
What does this mean for the economy?
At a very baseline level, this development is almost assuredly growth-negative over the next several quarters.
Before trying to determine the precise impact that this set of policies could have, it's important to provide some context. The pace of growth in the US economy was already slowing before the announcement. The consumer has remained resilient, mainly supported by consumption on the high end of the income spectrum. Government spending and fixed investment have been key contributors to the slowing pace of growth.
When thinking about the potential impact of the tariff announcement on growth, it is instructive to go through the different components of the growth calculation. As it pertains to the consumer, this set of policies adds downside risk. For one, a price bump is likely to weigh on aggregate demand. It's also important to consider that high and rising household net worth has supported consumption at the higher end of the income spectrum. Market action this week puts a dent in that trend. Survey data showed that consumer confidence had already taken a hit, and nothing we have seen is likely to lead to a reversal in this in the near-term.
Regarding government spending, it's fair to point out that one stated goal of the policy is to increase government revenues from tariffs significantly. However, this will play out over time, and as such, we should not expect a sudden boost to spending or a reduction in taxes to offset the potential hit to the consumer. Regarding investment, business sentiment has fallen as of late. This added degree of uncertainty, coupled with a possible deceleration in the US economy and uncertainty about the potential response from trade partners, makes it less likely that we'll see a pickup in business-fixed investment. Residential investment could see a tick up from lower interest rates, but this takes time to filter through, and as noted above, consumer sentiment could be poor for a period of time.
Positively, there are reasons to think that this could lead to greater business investment in the US in the coming years and that government revenues could be used to fund tax cuts. However, in a best-case scenario, these dynamics will likely be several quarters away.
We'd reiterate that the US economy was slowing before the announcement. It's our view that this set of policies presents downside risks to growth. However, we also want to reiterate that a recession is not guaranteed. Labor markets remain solid, and the US consumer continues to look healthy in aggregate. Risks to the downside do not automatically equate to a recession, even if the odds of one have risen.
What about inflation?
Inflation is likely to be a key concern for consumers, businesses, and the markets alike. After all, tariffs of this level should raise prices, at least initially.
While it is certainly possible that we will see a short-term uptick in prices, there are reasons to push back on the idea that this will be a highly inflationary policy mix. First, many households are already stretched, meaning businesses' ability to pass on prices and households' capacity to pay them may be low. This means that an uptick in prices may ultimately lead to a reduction in aggregate demand, curtailing businesses' ability to increase prices and pass those on to consumers.
The US inflation basket is also heavily tilted toward shelter and services. Tariffs on these items are likely to have a far greater impact on goods prices than on shelter and services, meaning that inflationary pressures could be well contained. This is especially true if aggregate demand is hit.
Finally, energy prices have been hit hard post-announcement. They are a key driver of inflation and inflation expectations in the US, offering another potential anchor to rising prices.
Pertaining to the above, it's notable that inflation break evens—market-derived inflation expectations—fell during the back half of the week.
What could this mean for markets moving forward? And what are we doing in response?
The simple answer is that this injects tremendous uncertainty into financial markets. We have seen this in the form of a broad market de-rating, and we're likely to see earnings estimates revised lower in the coming weeks.
We certainly acknowledge that periods of intense volatility are unsettling for investors. However, these periods are not necessarily unique. These sharp drawdowns are uncomfortable, but the reality is that we have seen them before, and we will see them again.
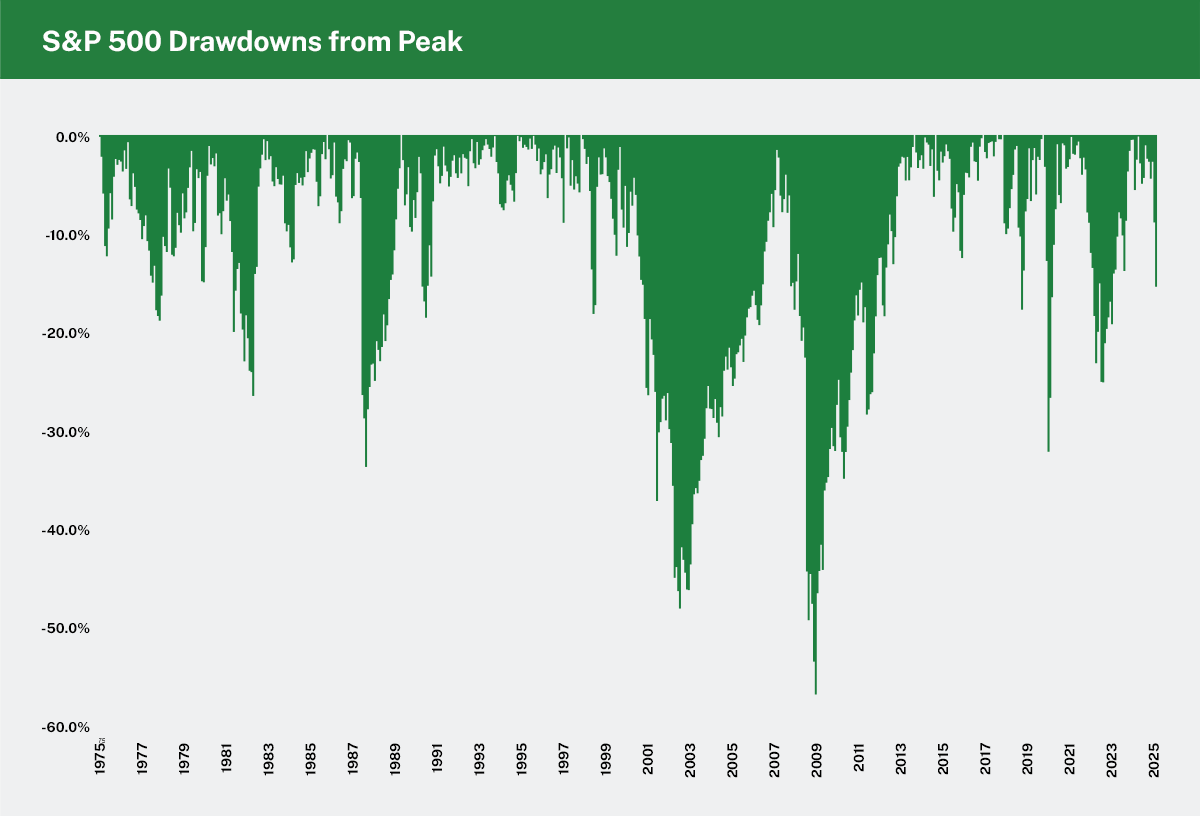
Analysis: Manning & Napier. Source: Bloomberg (04/01/1975-04/04/2025).
As an active manager, periods of volatility can present some of the greatest opportunities. Just as markets can decouple from fundamentals to the upside during periods of euphoria, periods of great uncertainty and worry can lead to markets acting irrationally on the downside.
We feel strongly that our time-tested investment strategies and valuation disciplines provide our team with a strong foundation upon which to approach these periods confidently. For now, this means ensuring that we are positioned in our strongest strategy fits and avoiding companies with a high degree of operating leverage and balance sheet risk.
As always, we are resolutely focused on managing risk in our portfolios. Periods of uncertainty heighten this focus. However, we will also lean into our more than 50 years of experience managing through different market cycles, including periods of volatility, and we will be resolutely focused on uncovering attractive investment opportunities as they present themselves.
We're here to help
We're always available if you'd like to schedule a call with a member of our team to talk about the current environment, solutions we offer, or other questions top of mind for you.
Schedule a callThe S&P 500 Total Return Index (S&P 500) is an unmanaged, capitalization-weighted measure comprised of 500 leading U.S. companies to gauge U.S. large cap equities. The Index returns do not reflect any fees or expenses. The index accounts for the reinvestment of regular cash dividends, but not for the withholding of taxes. Index returns provided by Bloomberg.
The NASDAQ Composite Index (Nasdaq) is a broad-based capitalization-weighted index of domestic and international based common type stocks listed in all three NASDAQ tiers: Global Select, Global Market and Capital Market. The NASDAQ Composite includes over 3,000 companies. The Index returns do not reflect any fees or expenses. Index returns provided by Bloomberg.
The Russell 2000® Index (Russell 2000) is an unmanaged index that consists of 2,000 U.S. small-capitalization stocks. The Index returns are based on a market capitalization-weighted average of relative price changes of the component stocks plus dividends whose reinvestments are compounded daily. The Index returns do not reflect any fees or expenses.
The S&P 500 Equal Weight Index is the equal-weight version of the S&P 500 index. The Index includes the same constituents as the S&P 500, but each company is allocated a fixed weight of 0.2% of the Index total at each quarterly rebalance. The Index returns assume daily reinvestment of dividends and do not reflect any fees or expenses. Index returns provided by Bloomberg.
The MSCI ACWI ex USA Index (All Country World ex. US) is designed to measure large and mid-cap representation across 22 of 23 Developed Markets countries (excluding the U.S.) and 24 Emerging Markets countries. The Index returns do not reflect any fees or expenses. The Index is denominated in U.S. dollars. Index returns are net of withholding taxes. They assume daily reinvestment of net dividends thus accounting for any applicable dividend taxation. Index returns provided by Bloomberg.
Index returns provided by Bloomberg. Index data referenced herein is the property of S&P Dow Jones Indices LLC, a division of S&P Global Inc., its affiliates (“S&P”), London Stock Exchange Group plc and its group undertakings (“LSE Group”), MSCI, its affiliates ("MSCI") and/or their third party suppliers and has been licensed for use by Manning & Napier. S&P, LSE Group, MSCI and their third party suppliers accept no liability in connection with its use. Data provided is not a representation or warranty, express or implied, as to the ability of any index to accurately represent the asset class or market sector that it purports to represent and none of these parties shall have any liability for any errors, omissions, or interruptions of any index or the data included therein. For additional disclosure information, please see: https://go.manning-napier.com/benchmark-provisions.
This material contains the opinions of Manning & Napier Advisors, LLC, which are subject to change based on evolving market and economic conditions. This material has been distributed for informational purposes only and should not be considered as investment advice or a recommendation of any particular security, strategy, or investment product. Information contained herein has been obtained from sources believed to be reliable, but not guaranteed.