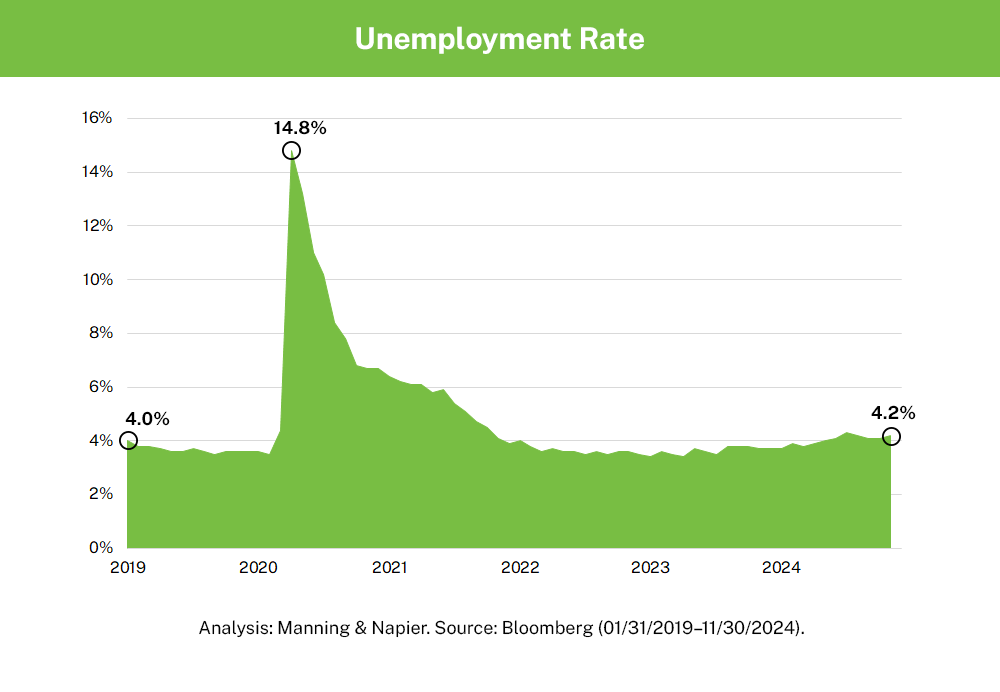
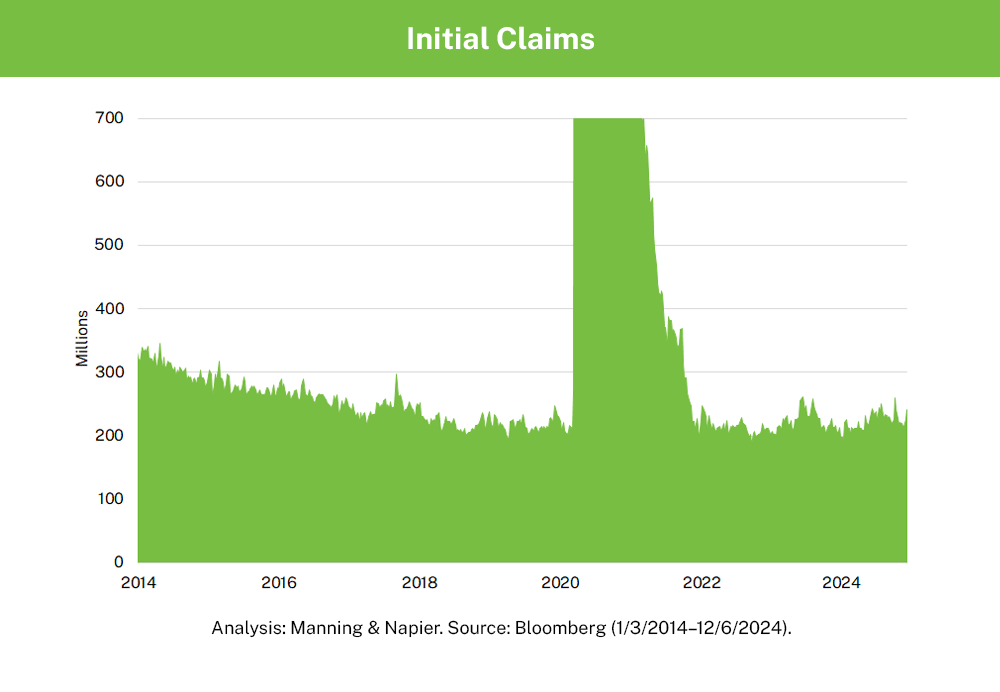
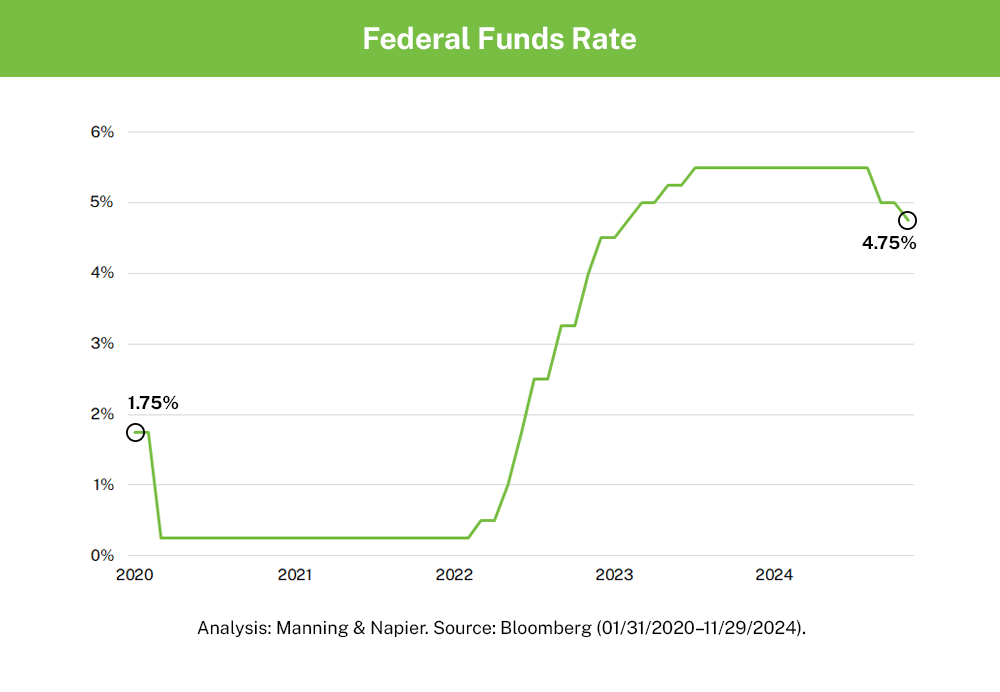
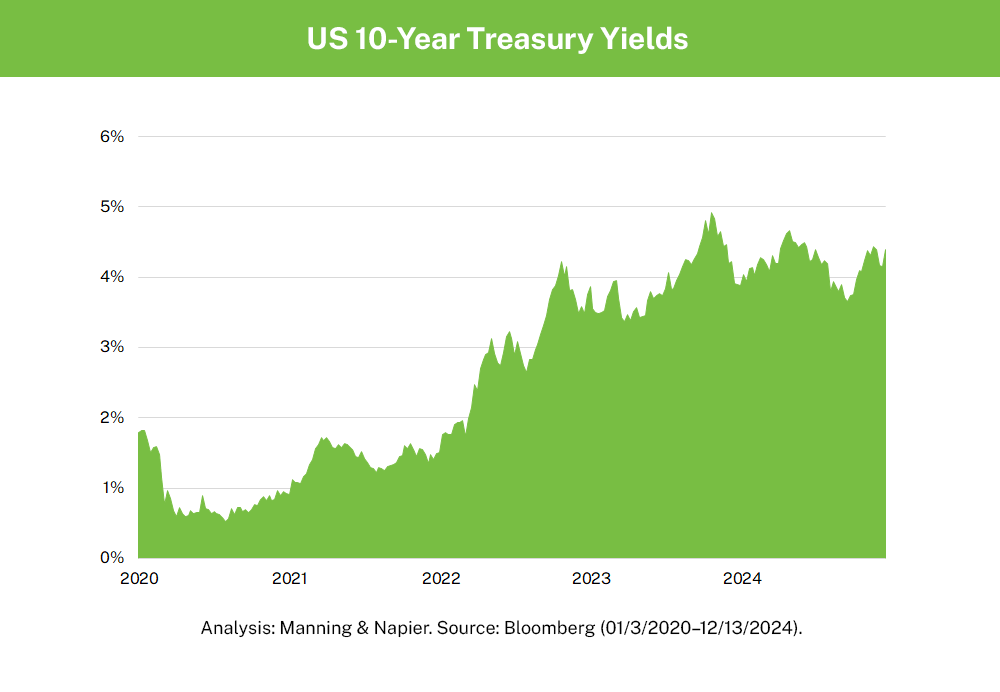
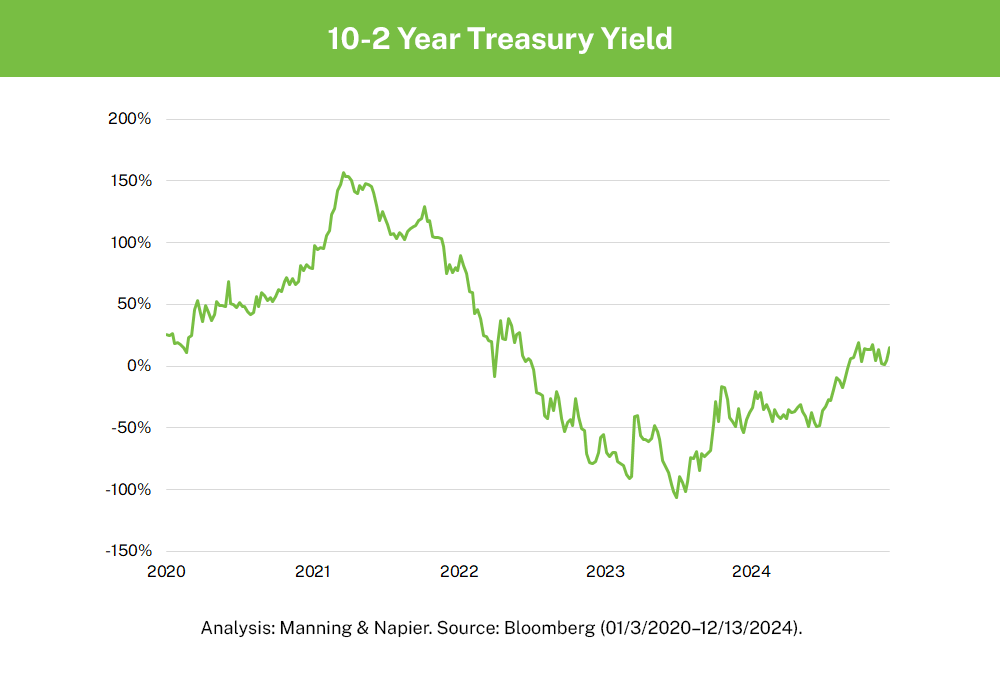
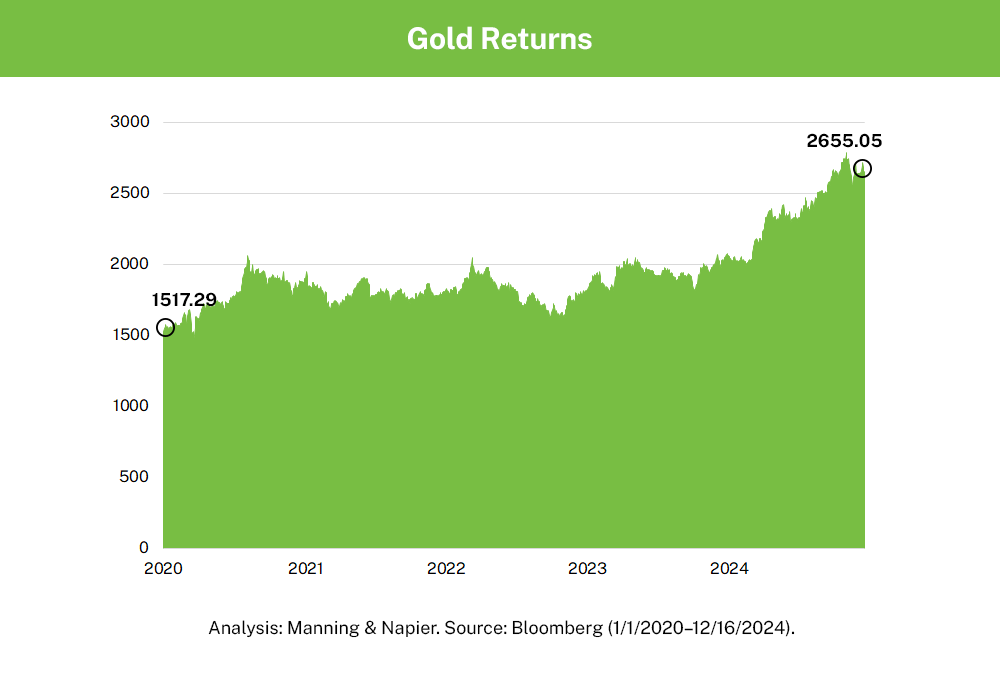
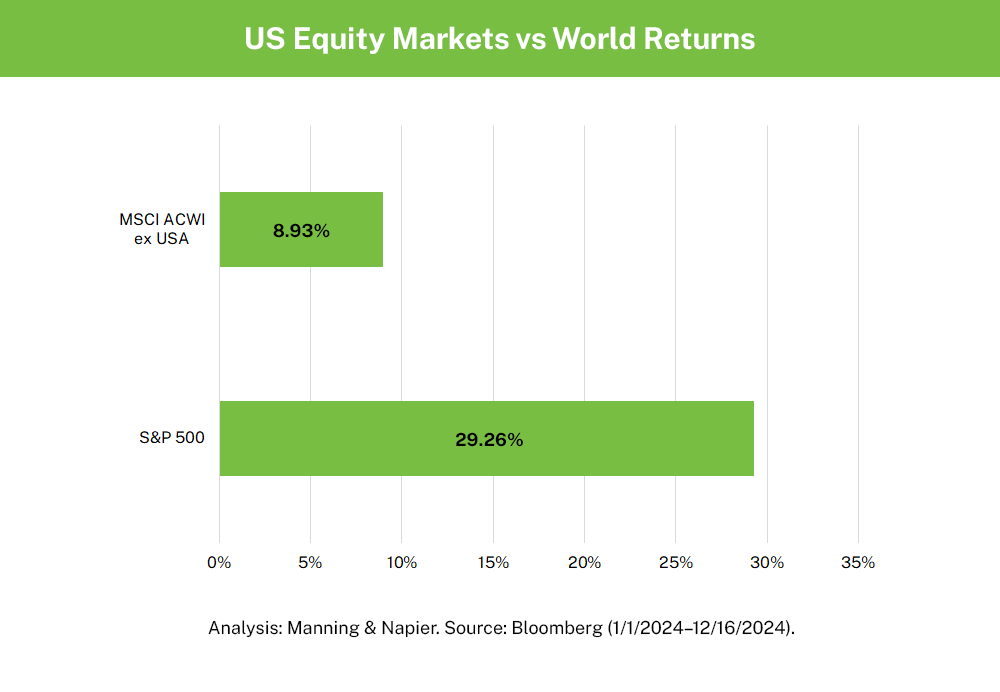
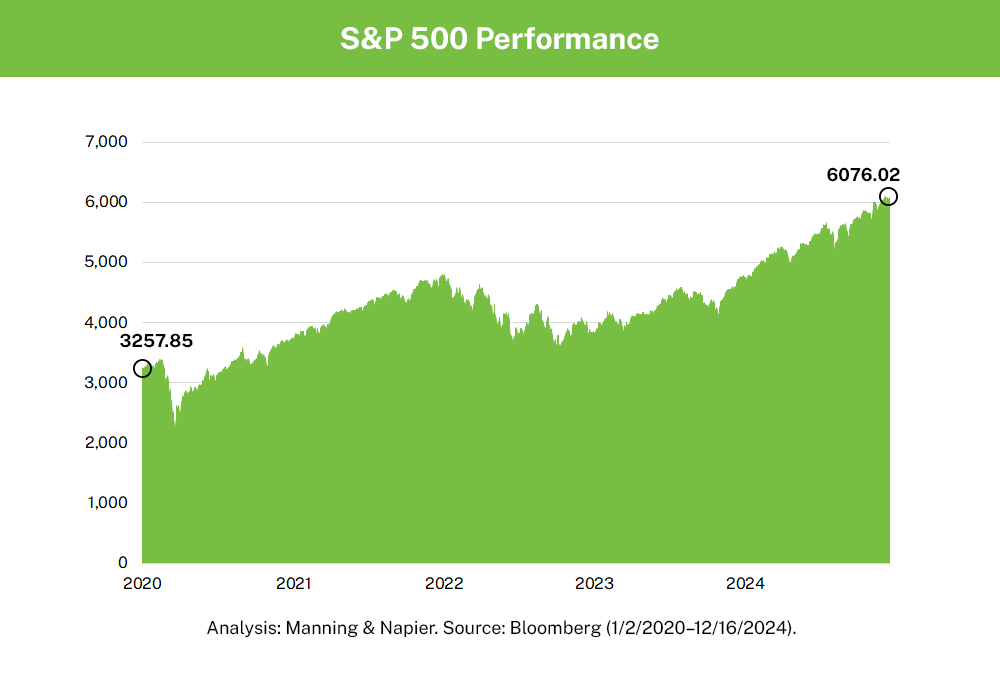
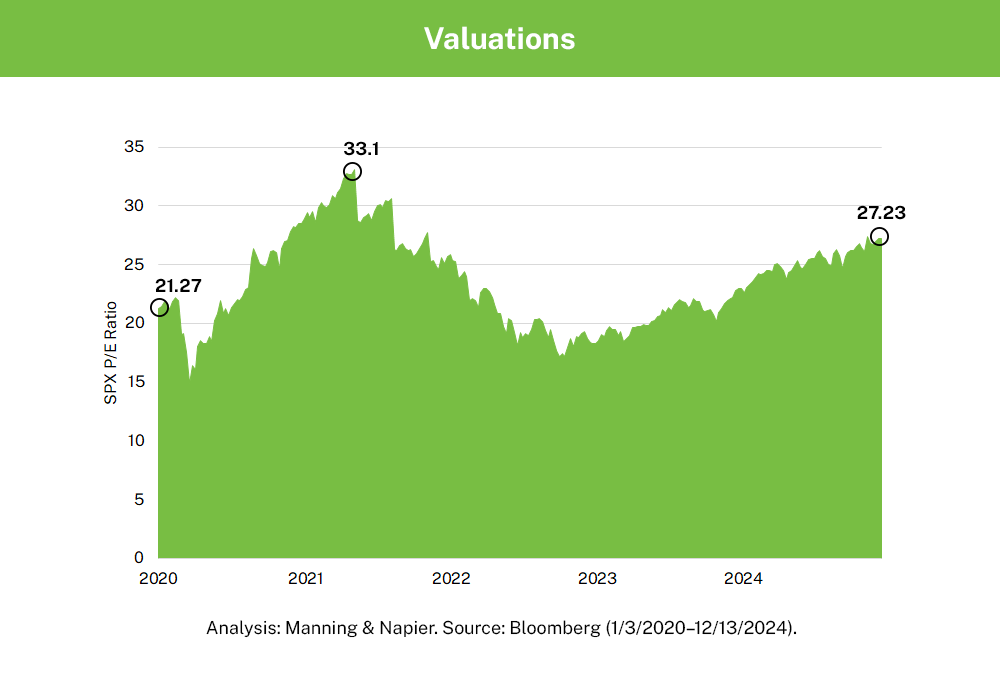
A lot can happen in a year. In 2024, inflation remained a hot topic as the Federal Reserve cautiously ended the longest pause after a rate hiking cycle in the Fed's history by cutting rates in September, the economy proved resilient, and equities delivered a strong performance.
Given how these moments (and others) shaped the current environment, we believe that the margin for error in financial markets is slim in 2025. With equities largely priced to perfection, discretion will be of paramount importance in pursuing opportunities, but also managing risk.
Before we put 2024 in the rearview mirror, let’s look back at 12 charts—one for each month—that defined 2024.
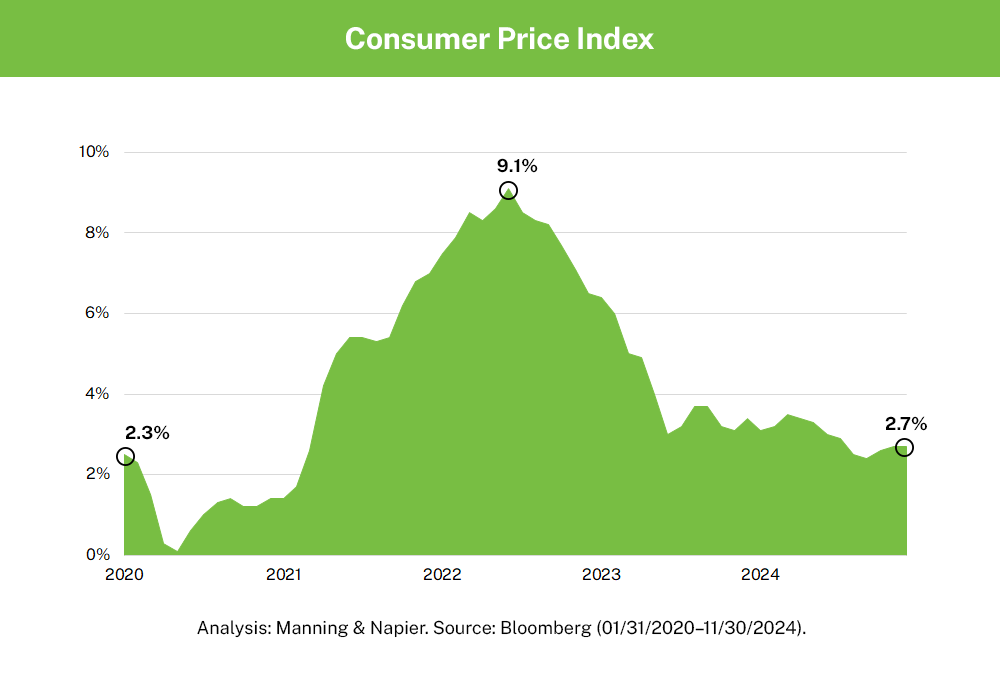
Inflation has been a dominant factor in global markets for several years now. Its rise brought about an aggressive hiking cycle and its trajectory from here will help determine the scale of the easing cycle we see both domestically and abroad.
Enjoying this information? Sign up to have new insights delivered directly to your inbox.
The S&P 500 Price Return Index is an unmanaged, capitalization-weighted measure comprised of 500 leading U.S. companies to gauge U.S. large cap equities. The Index returns do not reflect any fees, expenses, or adjust for cash dividends. Index returns provided by Bloomberg. Index data referenced herein is the property of S&P Dow Jones Indices LLC, a division of S&P Global Inc., its affiliates ("S&P") and/or its third party suppliers and has been licensed for use by Manning & Napier. S&P and its third party suppliers accept no liability in connection with its use. Data provided is not a representation or warranty, express or implied, as to the ability of any index to accurately represent the asset class or market sector that it purports to represent and none of these parties shall have any liability for any errors, omissions, or interruptions of any index or the data included therein. For additional disclosure information, please see: https://go.manning-napier.com/benchmark-provisions.
The MSCI ACWI ex USA Index (ACWIxUS) is designed to measure large and mid-cap representation across 22 of 23 Developed Markets countries (excluding the U.S.) and 24 Emerging Markets countries. The Index returns do not reflect any fees or expenses. The Index is denominated in U.S. dollars. Index returns are net of withholding taxes. They assume daily reinvestment of net dividends thus accounting for any applicable dividend taxation. Index returns provided by Bloomberg. Index data referenced herein is the property of MSCI, its affiliates ("MSCI") and/or its third party suppliers and has been licensed for use by Manning & Napier. MSCI and its third party suppliers accept no liability in connection with its use. Data provided is not a representation or warranty, express or implied, as to the ability of any index to accurately represent the asset class or market sector that it purports to represent and none of these parties shall have any liability for any errors, omissions, or interruptions of any index or the data included therein. For additional disclosure information, please see: https://go.manning-napier.com/benchmark-provisions.
This material contains the opinions of Manning & Napier Advisors, LLC, which are subject to change based on evolving market and economic conditions. This material has been distributed for informational purposes only and should not be considered as investment advice or a recommendation of any particular security, strategy, or investment product. Information contained herein has been obtained from sources believed to be reliable, but not guaranteed.

