We believe that a portfolio’s construction and related policy guidelines should be centered around an organization’s goals. What are your organization’s expectations for portfolio growth, spending, and volatility? And therefore, what guidelines will give you the best chance of success?
Before crafting policies and building portfolios, it’s always important to understand an endowment or foundation’s unique situation, as goals and objectives can vary meaningfully from organization to organization. One way to illustrate just how important this is can be to examine the outcomes that would have occurred under two scenarios over the real-world market environment of the past decade.

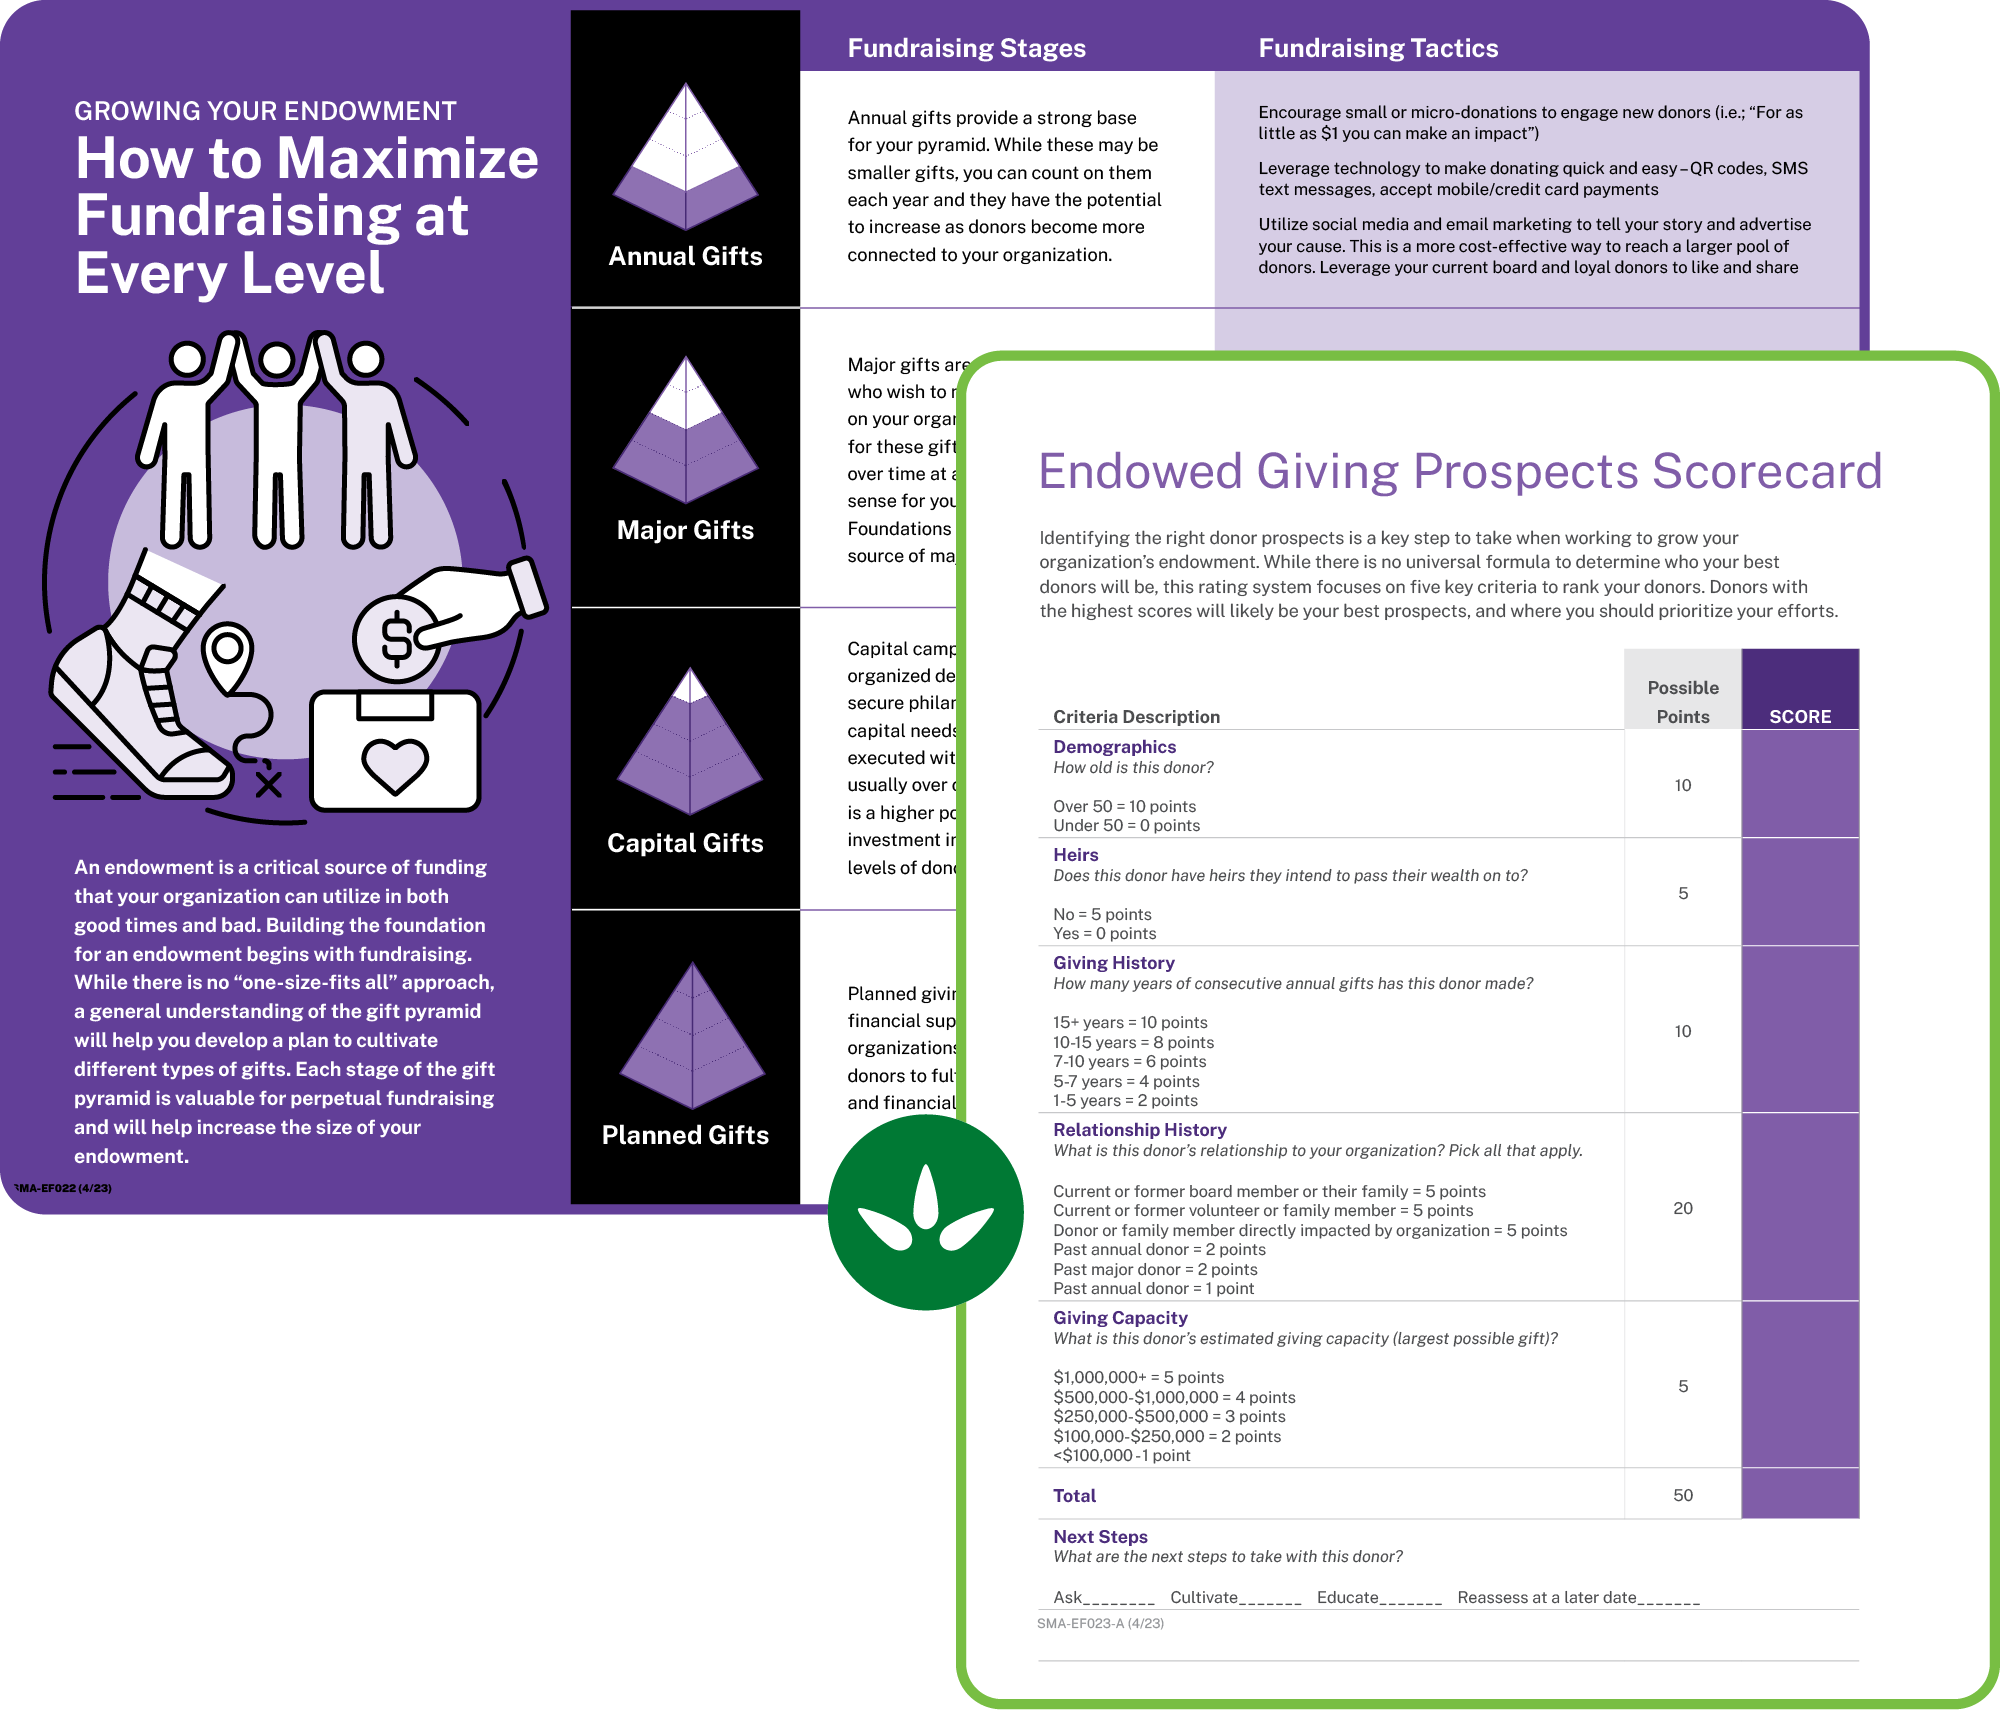
Boost your fundraising
Your fundraising strategy is just as important as a strong investment strategy. When paired together, you can set your organization up to be able to serve your community for decades. With a variety of resources, templates, and actionable tips, this free toolkit can help you take your fundraising to the next level and grow your endowment.
Download nowWith advances in AI, contentious elections, high inflation, and COVID lockdowns – the last 10 years have certainly been interesting for investors, to say the least. Imagine you could travel back to a decade ago where you are the chairperson of an investment committee in charge of a $10 million endowment. You’ve had a planning meeting with your committee, and you’ve come to a fork in the road with two scenarios:
Scenario A: Maintain |
Scenario B: Grow |
|
Goals |
|
|
Spending Guidelines |
|
|
Allocation Guidelines |
|
|
What would have happened over the last decade (2014-2024) under each of these two scenarios?
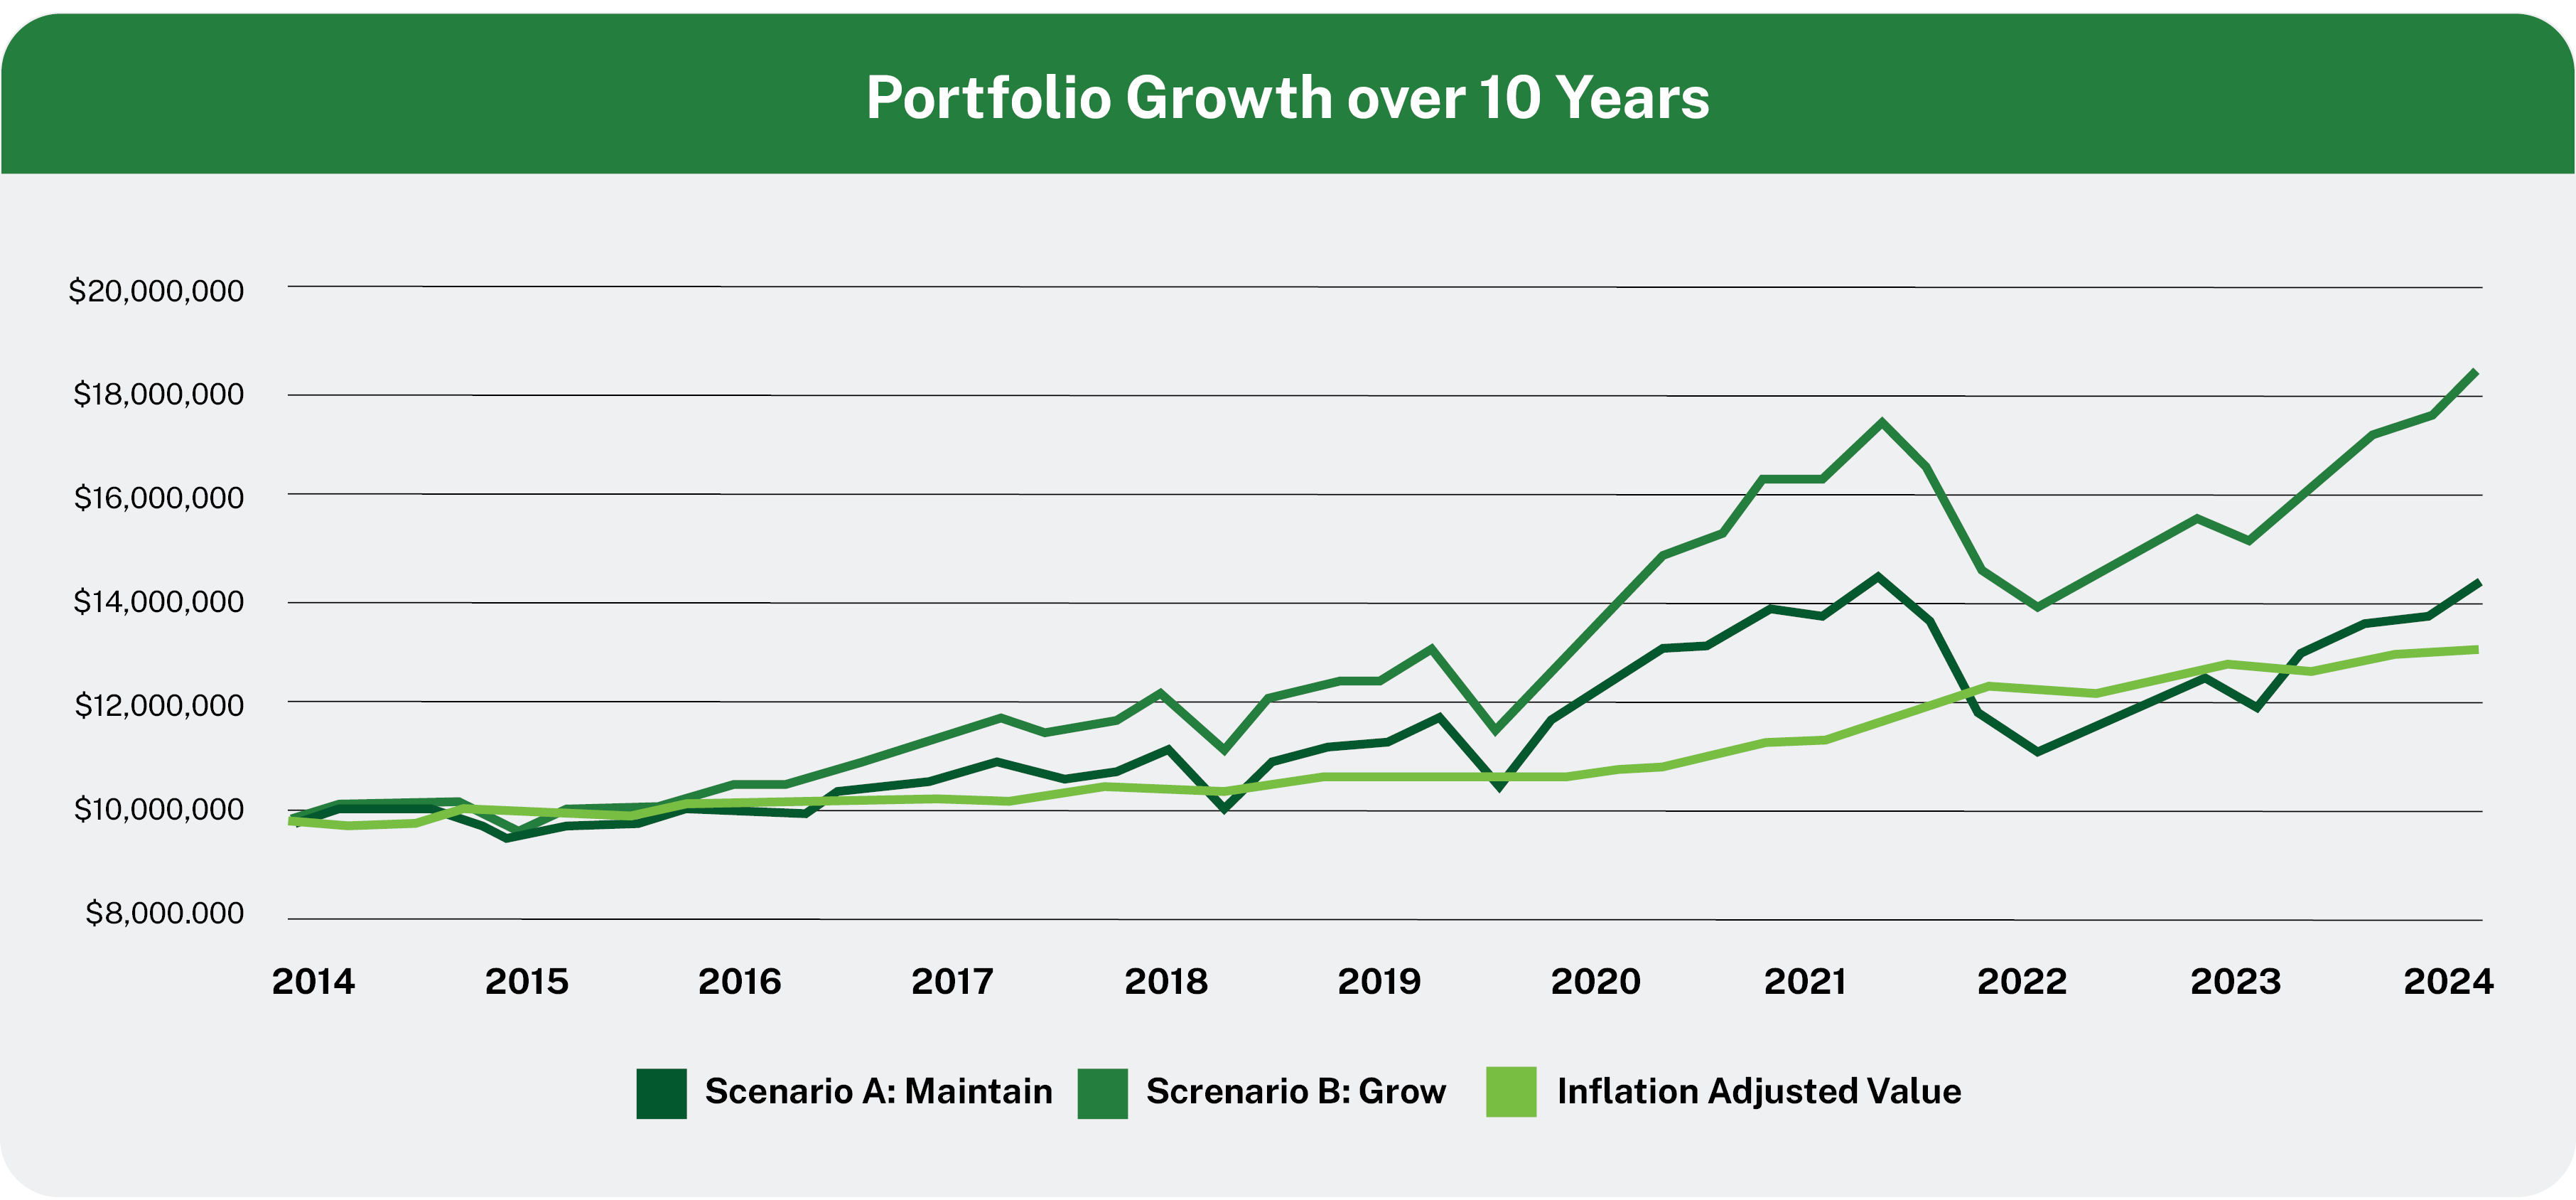
Using actual index returns for the allocation guidelines indicated above, the chart below depicts the change in portfolio value for each scenario and relative to inflation.

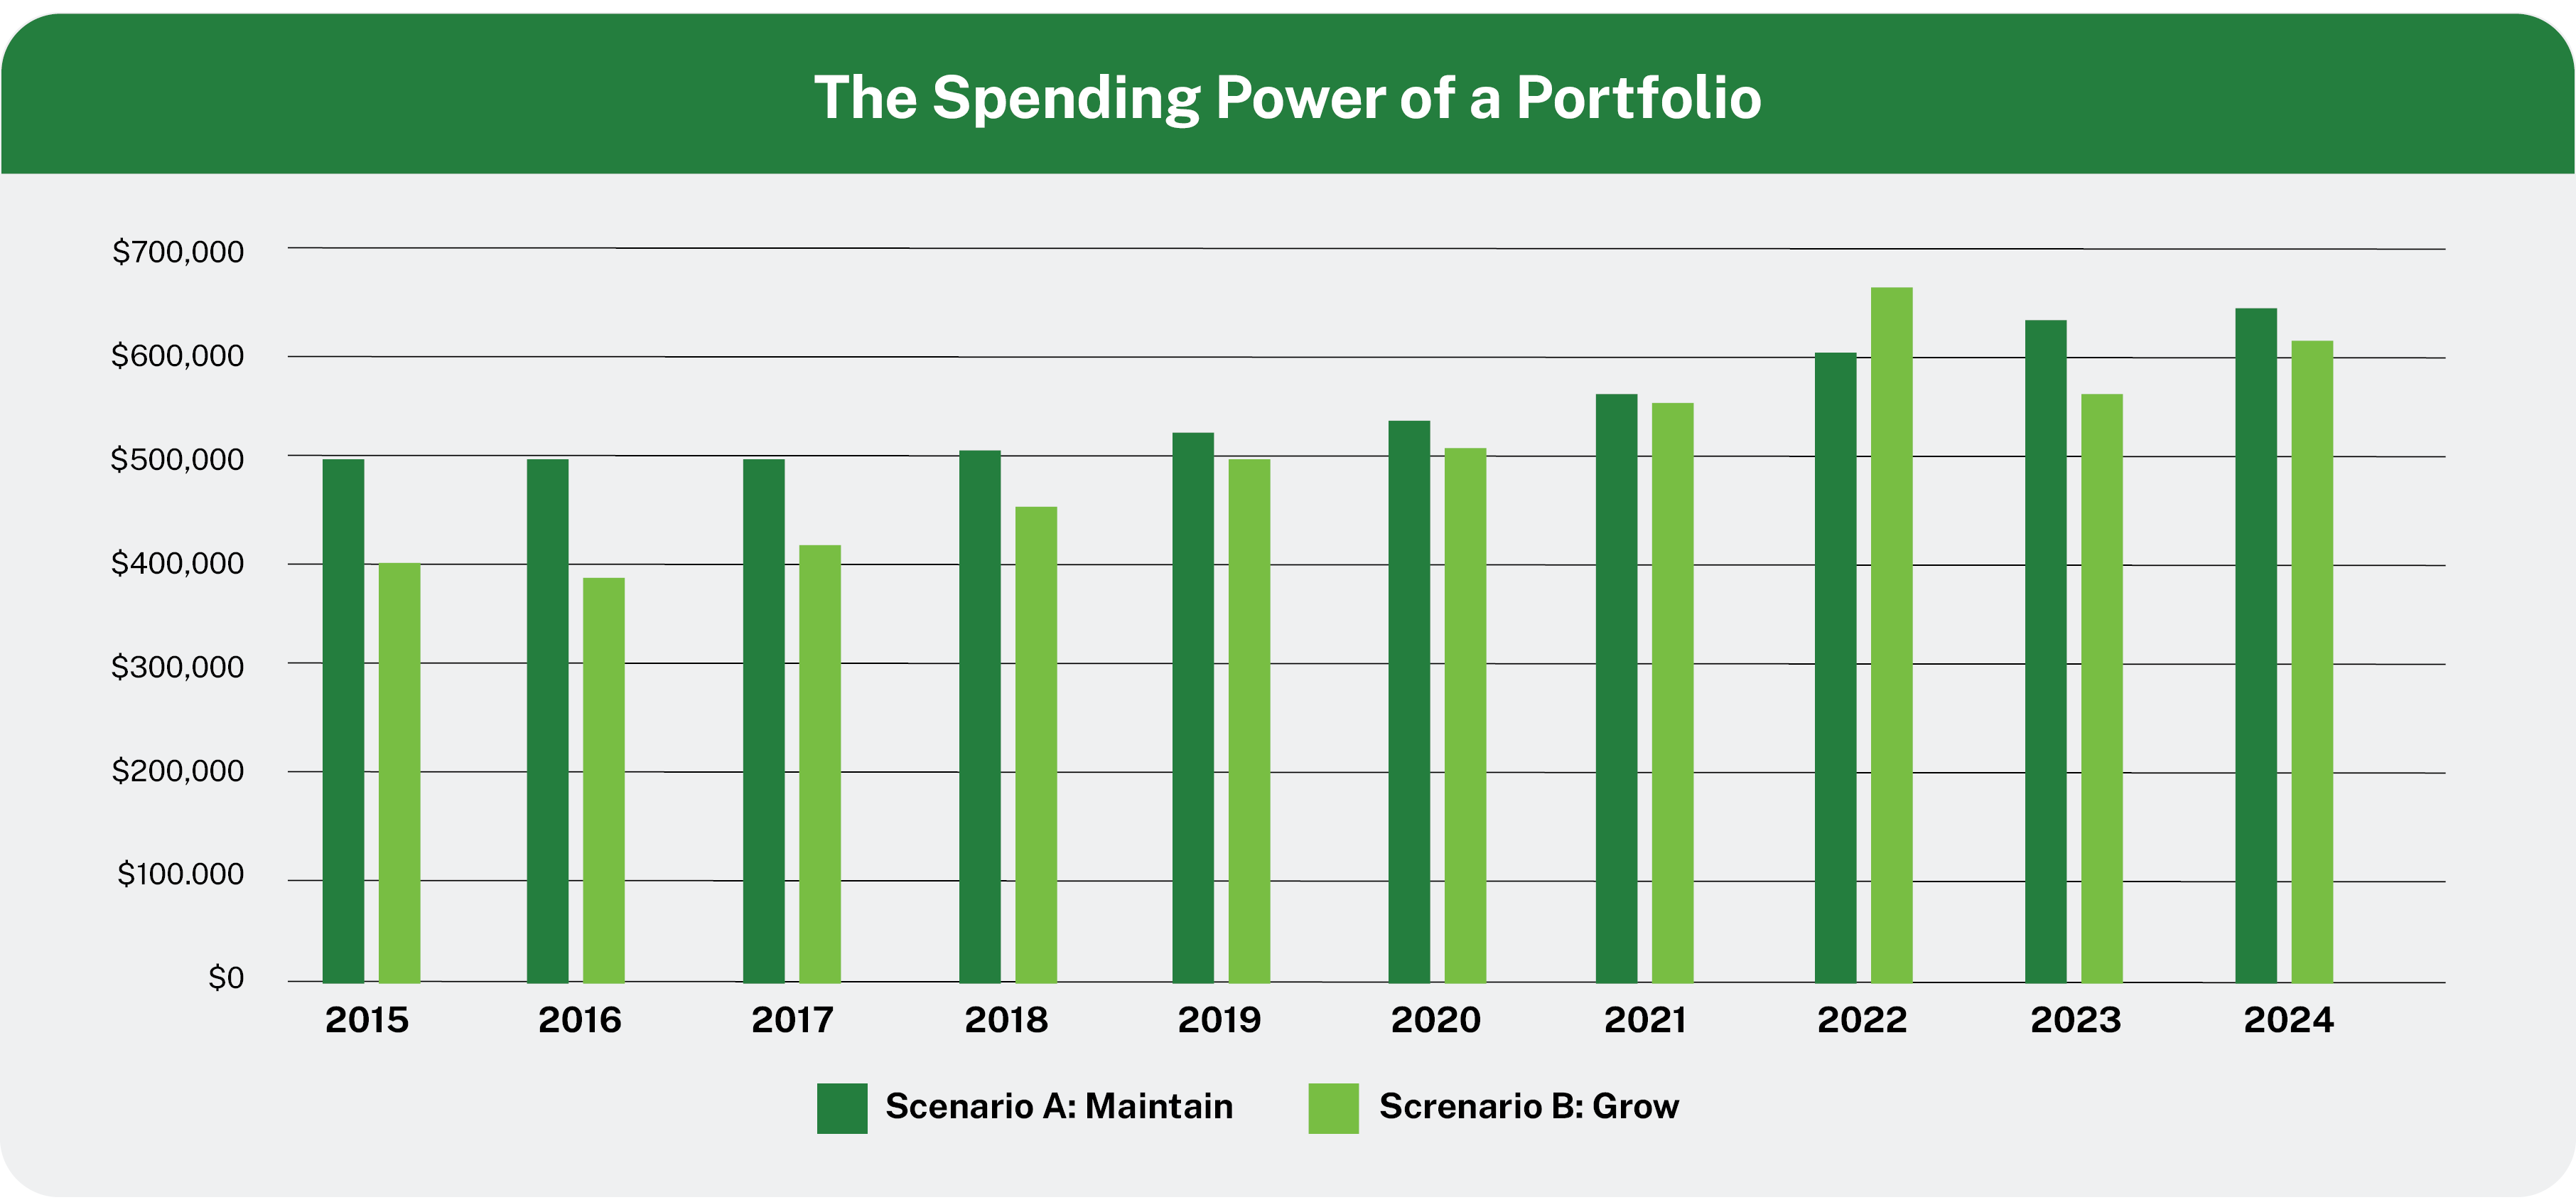
Additionally, the following chart depicts the year-by-year spending that the portfolio would have produced over those 10 years.

Understanding the Outcomes
First, both sets of guidelines would have largely succeeded in meeting their goals. Scenario A would have maintained its purchasing power relative to inflation – although the market drawdown and high inflation in 2022 made it a close call. Scenario A also had annual withdrawals that were predictable and rose steadily in value each year.
In scenario B, the portfolio grew in value from $10 million to $18.5 million, while still generating total spending of over $5 million to support this organization. However, because it didn’t apply a smoothed spending rule, the withdrawal amount fell considerably after 2022, reflecting that scenario’s greater comfort level with volatility of spending.
Don’t Underestimate the Role of the Market
What partially explains these outcomes is the market. Recent stock market returns have been on the higher end of their historical range, and alternative investments (especially within private markets) have generally provided a high level of diversification and risk-adjusted return. Alternative investments also commonly have liquidity restrictions, limited access, and less valuations, meaning that it is important to evaluate a portfolio’s suitability before undertaking an allocation. Returns for bonds have been challenged over the last 10 years and the recent spike in inflation has led to a difficult environment for many portfolios.
Yet, the Power is in the Guidelines
But clearly, the greatest impact on relative results between the two scenarios came from the guidelines this hypothetical investment committee established at the onset.
Neither scenario is right or wrong. Both were designed to reflect the priority of goals established by the committee. To take that point a step further, what if the guidelines were reversed between the two scenarios and therefore not aligned with the stated goals? Both scenarios would have failed – the “Maintain” scenario (A) would not have done well at providing a predictable and stable withdrawal, and the “Grow” scenario (B) would have fallen short of the growth that the portfolio could have otherwise achieved.
Results over the last decade illustrate an important lesson – the key to achieving your investment goals lies in your portfolio’s guidelines. Making the time to ensure that the goals and guidelines are aligned will set you up for long-term success.
This reality should help remind fiduciaries about the importance of a plan and having guidelines that are well-positioned to meet your goals. Consider what lessons this may hold for your own endowment or foundation.
Grow your endowment
We can help your organization ensure your guidelines and goals are aligned. Schedule a call with us to review your current approach and identify opportunities for growing your endowment, and develop a comprehensive financial and investment plan, alongside other services like fundraising support, board and staff education, and more.
Schedule a callScenario A assumes 5% annual withdrawals as a percent of average portfolio value over the prior 12 quarters. Withdrawals are calculated at the beginning of a calendar year and then prorated in equal installments over the subsequent 4 quarters.
Scenario B assumes 4% annual withdrawals as a percent of average portfolio value over the prior 12 quarters. Withdrawals are calculated at the beginning of a calendar year and then prorated in equal installments over the subsequent 4 quarters.
Portfolio returns, withdrawals and inflation adjustments are applied on a quarterly basis.
Index data referenced herein is the property of S&P Dow Jones Indices LLC, a division of S&P Global Inc., its affiliates ("S&P") (Bloomberg), and/or its third party suppliers and has been licensed for use by Manning & Napier. S&P and its third party suppliers accept no liability in connection with its use. Data provided is not a representation or warranty, express or implied, as to the ability of any index to accurately represent the asset class or market sector that it purports to represent and none of these parties shall have any liability for any errors, omissions, or interruptions of any index or the data included therein. For additional disclosure information, please see: https://go.manning-napier.com/benchmark-provisions.
Stock returns are represented by the S&P 500 Total Return Index. The S&P 500 Total Return Index is an unmanaged, capitalization-weighted measure comprised of 500 leading U.S. companies to gauge U.S. large cap equities. The Index returns do not reflect any fees or expenses. The index accounts for the reinvestment of regular cash dividends, but not for the withholding of taxes. Index returns provided by Bloomberg.
Fixed income returns are represented by the Bloomberg U.S. Aggregate Bond Index. The Bloomberg U.S. Aggregate Bond Index is an unmanaged, market-value weighted index of U.S. domestic investment-grade debt issues, including government, corporate, asset-backed, and mortgage-backed securities, with maturities of one year or more. Index returns do not reflect any fees or expenses. Index returns provided by Intercontinental Exchange (ICE).
Diversified alternatives are represented by the PitchBook Private Capital All US Index. The PitchBook Private Capital All US Index is an unmanaged, capitalization weighted index of U.S. private investments where PitchBook has access to cash flow and NAV data. Private Capital includes funds in the private equity, venture capital, real estate, real assets, private debt, and fund of funds classifications. The index is not practically investible and is subject to change based on an update to the dataset. Index returns provided by Morningstar.
The information in this paper is not intended as legal or tax advice. Consult with an attorney or a tax or financial advisor regarding your specific legal, tax, estate planning, or financial situation.


