
With the election under six months away, it’s only natural to be concerned about the market implications of different outcomes. After all, the economy is slowing, inflation is threatening to remain elevated, and financial markets look fully priced. Could elections be the straw that breaks the camel’s back? How might markets react to a sweep, or alternatively, the promise of gridlock under a divided government? How might various policy objectives affect different asset classes or sectors in the equity market?
Here's our perspective on the markets as we inch closer to November.
What does the election mean for markets?
History shows that the reality of election years is often far less interesting than perception. Markets tend to do fairly well in election years, and we have minimal instances of significant drawdowns in the six months prior to general elections. This is not to say that we can’t get volatility or a pronounced drawdown; rather, elections are rarely a catalyst for meaningful moves lower. That said, this does not mean that we do not see risk in markets today.
A History of Market Drawdowns: The 25 Largest Since 1928
| Peak | Trough | Cumulative Drawdown | Election within (+/-) 6 months of peak? |
Notes |
| 9/16/1929 | 6/1/1932 | -86.20% | No | Great Depression |
| 10/9/2007 | 3/9/2009 | -55.20% | No | Global Financial Crisis |
| 9/1/2000 | 10/9/2002 | -47.40% | Yes | TMT Bubble, Enron/WorldCom, 9/11 |
| 1/11/1973 | 10/3/1974 | -44.80% | Yes | Nifty 50 Bubble |
| 2/19/2020 | 3/23/2020 | -33.80% | No | COVID Pandemic Bear Market |
| 8/25/1987 | 10/19/1987 | -32.90% | No | ‘87 Crash, Black Monday |
| 11/29/1968 | 5/26/1970 | -32.60% | Yes | Vietnam War |
| 12/12/1961 | 6/26/1962 | -26.90% | No | Flash Crash of 1962 |
| 5/29/1946 | 5/19/1947 | -25.20% | No | Post-World War II |
| 1/3/2022 | 10/12/2022 | -24.50% | No | Post-Pandemic Supply Chain Crisis |
| 2/9/1966 | 10/7/1966 | -20.20% | No | Bear Market, Credit Crunch of 1966 |
| 11/28/1980 | 8/12/1982 | -20.20% | Yes | Double-dip Recession |
| 7/15/1957 | 10/22/1957 | -19.80% | No | Eisenhower Recession |
| 9/20/2018 | 12/24/2018 | -19.40% | No | Trade War with China, Global Economic Growth Slowdown |
| 7/16/1990 | 10/11/1990 | -19.20% | No | The Gulf War |
| 7/17/1998 | 8/31/1998 | -19.20% | No | Asian Currency Crisis |
| 2/13/1980 | 3/27/1980 | -16.70% | No | Silver Thursday |
| 12/31/1976 | 3/6/1978 | -14.40% | Yes | Stagflation, Financial Crash of 1978 |
| 8/2/1956 | 2/12/1957 | -13.20% | No | Post-War Raising Interest Rates and Slowing Economic Growth |
| 7/20/2015 | 2/11/2016 | -13.00% | No | Global Stock Market Selloff |
| 9/12/1978 | 11/14/1978 | -12.80% | No | Oil Shock |
| 1/5/1953 | 9/14/1953 | -12.40% | Yes | Post-Korean War |
| 4/28/1971 | 11/23/1971 | -12.40% | No | Nixon Shock |
| 6/12/1950 | 7/17/1950 | -12.00% | No | Korean War |
| 7/16/1999 | 10/15/1999 | -11.80% | No | Dotcom Bubble Begins to Collapse |
Analysis: Manning & Napier. Source: Bloomberg (1927 – 2024).
As we alluded to above, the US economy is clearly slowing, which is a threat to corporate revenue growth. Inflation remains elevated, putting upward pressure on yields, threatening margins. Valuations do not appear to adequately reflect these risks. Yet we do not believe that the election will be the catalyst to bring these risks into focus and as such, we view it largely as a potential source of short-term volatility.
How volatile are markets during an election year?
The short answer is that the risk versus reward profile of the market is no worse than non-election years. 100 years (or so) of data suggests that election years are generally no more or less risky than non-election years.
Daily volatility has been marginally higher in election years: 20.1% vs. 18.4% for non-election years based on daily total return data back to 1928. Note that daily volatility is a standard deviation of daily returns expressed as an annualized rate.
Annual Returns for US Large Cap Stocks from 1928 - 2023
| Presidential Election Years | Other Years | |
| Average | 11.0% | 11.6% |
| % Positive | 83% | 69% |
Analysis: Manning & Napier. Source: Bloomberg (12/31/1927 - 12/31/2023). US Large Cap Stocks are represented by the S&P 500 Total Return Index.
What are the potential implications of various scenarios?
Despite our belief that the election in and of itself is not likely to be a market catalyst, there is no doubt that policy will vary in outcomes. To simplify the range of potential outcomes as much as possible, we will end up in one of three scenarios: A Democratic sweep, a Republican sweep, or divided government.
Given any number of factors, ranging from time to a constantly changing world, it is nearly impossible to predict what policy priorities would be under these various scenarios and then to accurately apply that to financial markets. Yet we can take a step back and draw broader conclusions.
With the highly polarized nature of politics today, cats and dogs living together in harmony seems more likely than Democrats and Republicans setting their differences aside to pursue well-telegraphed policy objectives. Thus, reduced government spending seems to be the best bet under a divided government. The opposite is likely under a unified government—neither side seems particularly concerned about addressing government debt and reining in deficits so long as they’re the ones spending the money. Thus, we would expect a unified government to keep deficits running at a level well above what we saw prior to COVID. This would likely put upward pressure on both growth and inflation and in turn, US Treasury yields.
The other unifying thread under any government is likely to be the continued deteriorating relations between the US and China. The increase in geopolitical tensions is structural in nature, and while it may ebb and flow, the trend is clear. While the speed and scope of the deterioration may well vary under different election outcomes, the direction of travel over the long term appears set. The largest variance is likely to be in the treatment of European, Asian, and Latin American allies. Under a Republican administration, we’d expect more broad-based challenges, whereas a Democrat-led government would likely see a continued attempt to work with our traditional allies in a less adversarial way.
Are there any planning considerations to be mindful of?
Whether it’s general financial planning, tax planning, or estate planning, there’s always a degree of strategizing that can be done to keep momentum toward your short- and long-term goals. However, regarding the upcoming election, eyes are on the Tax Cuts and Jobs Act of 2017 (TCJA).
The TCJA of 2017 impacted most taxpayers through a series of changes including adjustments to tax brackets and tax rates, bonus depreciation, and estate and gift tax exemptions. At the end of 2025, most of these are set to revert – unless congressional action is taken. Most notably, most income tax brackets are set to increase, reverting back to 2017 levels.
Married Filing Jointly Tax Brackets Throughout the Years
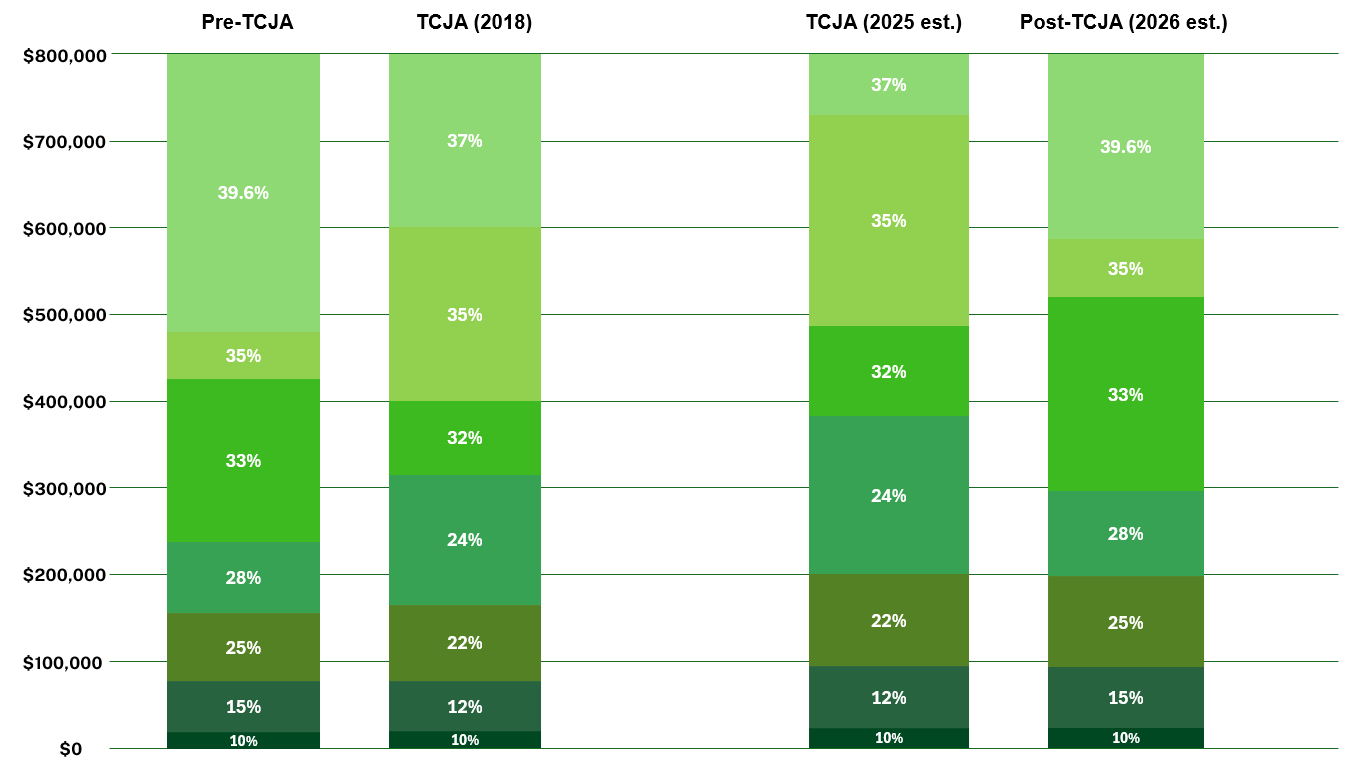
For illustrative purposes only.
Analysis: Manning & Napier. Source: Congress.gov.
The election may still be six months away, and the sunset more than a year, but it’s prudent to start thinking about how your taxes might change in 2026, especially since the election may or may not impact the legislation framework or extension of the TCJA provisions. As planners, we prefer to look out over the long-term, seeking to minimize and smooth taxes over many years and positioning for multiple potential tax environments. We are here, ready to discuss strategies for managing your lifetime tax bill and maximizing the probability of achieving all your financial goals.
Putting this all together, how should investors approach the election year? Our answer is unlikely to surprise those who know us well. We believe that investors will be best served by maintaining a long-term focus. While it is entirely possible—and frankly, likely—that the run up to and the period after the election will see bouts of volatility, we are likely to see these as buying opportunities. In the meantime, focus on controlling the controllables such as reviewing your financial plan and implementing strategies that will keep you on track toward your goals.
We're here to help
We're always available if you'd like to schedule a call with a member of our team to talk about the current environment, solutions we offer, or other questions top of mind for you.
Schedule a callThis material contains the opinions of Manning & Napier Advisors, LLC, which are subject to change based on evolving market and economic conditions. This material has been distributed for informational purposes only and should not be considered as investment advice or a recommendation of any particular security, strategy, or investment product. Information contained herein has been obtained from sources believed to be reliable, but not guaranteed.
Please consult with an attorney or a tax or financial advisor regarding your specific legal, tax, estate planning, or financial situation. The information in this article is not intended as legal or tax advice.
The S&P 500 Total Return Index is an unmanaged, capitalization-weighted measure comprised of 500 leading U.S. companies to gauge U.S. large cap equities. The Index returns do not reflect any fees or expenses. The index accounts for the reinvestment of regular cash dividends, but not for the withholding of taxes. Index returns provided by Bloomberg. Index data referenced herein is the property of S&P Dow Jones Indices LLC, a division of S&P Global Inc., its affiliates ("S&P", Bloomberg) and/or its third party suppliers and has been licensed for use by Manning & Napier. S&P and its third party suppliers accept no liability in connection with its use. Data provided is not a representation or warranty, express or implied, as to the ability of any index to accurately represent the asset class or market sector that it purports to represent and none of these parties shall have any liability for any errors, omissions, or interruptions of any index or the data included therein. For additional disclosure information, please see: https://go.manning-napier.com/benchmark-provisions.